The Surface Water Ocean Topography satellite, or SWOT, was in the right place at the moment when an earthquake of magnitude 8.8 occurred off the coast of the Kamchatka Peninsula on July 29, becoming one of the most powerful earthquakes recorded since 1900.
In a study published in The Seismic Record, high-quality satellite imagery of a major tsunami in a subduction zone was obtained for the first time. Instead of observing the simple propagation of a single wave, the data revealed complex interactions and wave scattering throughout the Pacific Ocean basin, contradicting previous expectations.
Researcher Ángel Ruiz-Angulo from the University of Iceland and his team used satellite data in conjunction with measurements from deep-water DART buoys located along the tsunami's path, allowing them to refine the parameters of the earthquake that generated the waves.
Ruiz-Angulo drew an analogy, comparing SWOT data to new glasses. Previously, using DART buoys, researchers could only obtain information about tsunamis at specific points in the ocean, while other satellites captured only a narrow line. SWOT, however, offers a swath up to 120 kilometers wide with high-resolution data on sea surface.
Launched in December 2022 as part of a joint NASA and French space agency mission, SWOT aims to conduct the first global survey of Earth's surface waters, covering oceans, rivers, and lakes. Ruiz-Angulo's team and his colleague Charlie de Marrez analyzed satellite data for over two years, focusing on studying everyday ocean processes, and did not expect to capture a tsunami.
The study's results cast doubt on traditional views of large tsunami behavior. They were previously described as non-dispersive waves, implying that they should propagate in a single stable form. However, SWOT data challenged this theory.
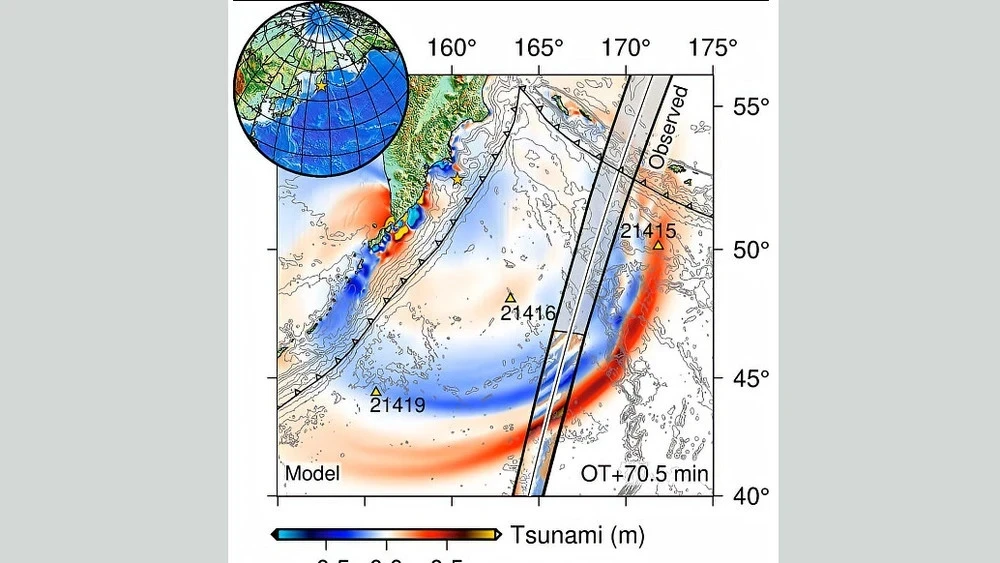
By comparing satellite data with computer modeling, researchers found that models accounting for wave dispersion matched actual observations more accurately than traditional ones. This indicates that the main wave may change under the influence of trailing waves as it approaches the shore, and this effect needs to be quantitatively assessed.
Additionally, researchers found a discrepancy between the predicted and actual arrival times of the tsunami recorded by two DART sensors. One sensor recorded the tsunami earlier than expected, while the other recorded it later.
After studying buoy data, the team revised the tsunami source, determining that the rupture from the earthquake extended further south than previously thought, by about 400 kilometers, significantly exceeding the 300-kilometer estimate proposed by other models.
Co-author of the study Diego Melgar emphasized that after the devastating 9.0 magnitude earthquake in Japan in 2011, it became clear that tsunami data could provide valuable information for determining slip boundaries at shallow depths. His laboratory, along with other research groups, continues to work on integrating DART data into earthquake and tsunami analysis, which has not yet become routine practice.
Melgar highlighted the need to combine different types of data. Hydrodynamic models used for DART analysis differ significantly from seismic wave propagation models applied to study solid Earth data, but the combination of various data types is critically important for improving prediction accuracy.
The Kuril and Kamchatka subduction zone is known for its large tsunamis, including the devastating event of 1952 caused by a 9.0 magnitude earthquake. This led to the creation of an international tsunami warning system, which also issued warnings during the 2025 event.
Ruiz-Angulo expressed hope that similar studies in the future will justify the need for satellite observations for real-time tsunami forecasting.


